CDN reports and overview
CDN reporting includes Overview for current performance and health, Statistics for standard traffic and response metrics, and optional Advanced Analytics for detailed audience and traffic breakdowns.
CDN Overview in the portal
The Overview page is the default CDN landing page in the CDB Customer Portal. It summarizes CDN performance and traffic across all resources or a selected resource for a specified period.
- 1
Open CDN Overview
In the Customer Portal, navigate to CDN > Overview.
- 2
Filter dashboard data
Select all resources or a specific CDN resource, then select a predefined or custom period.
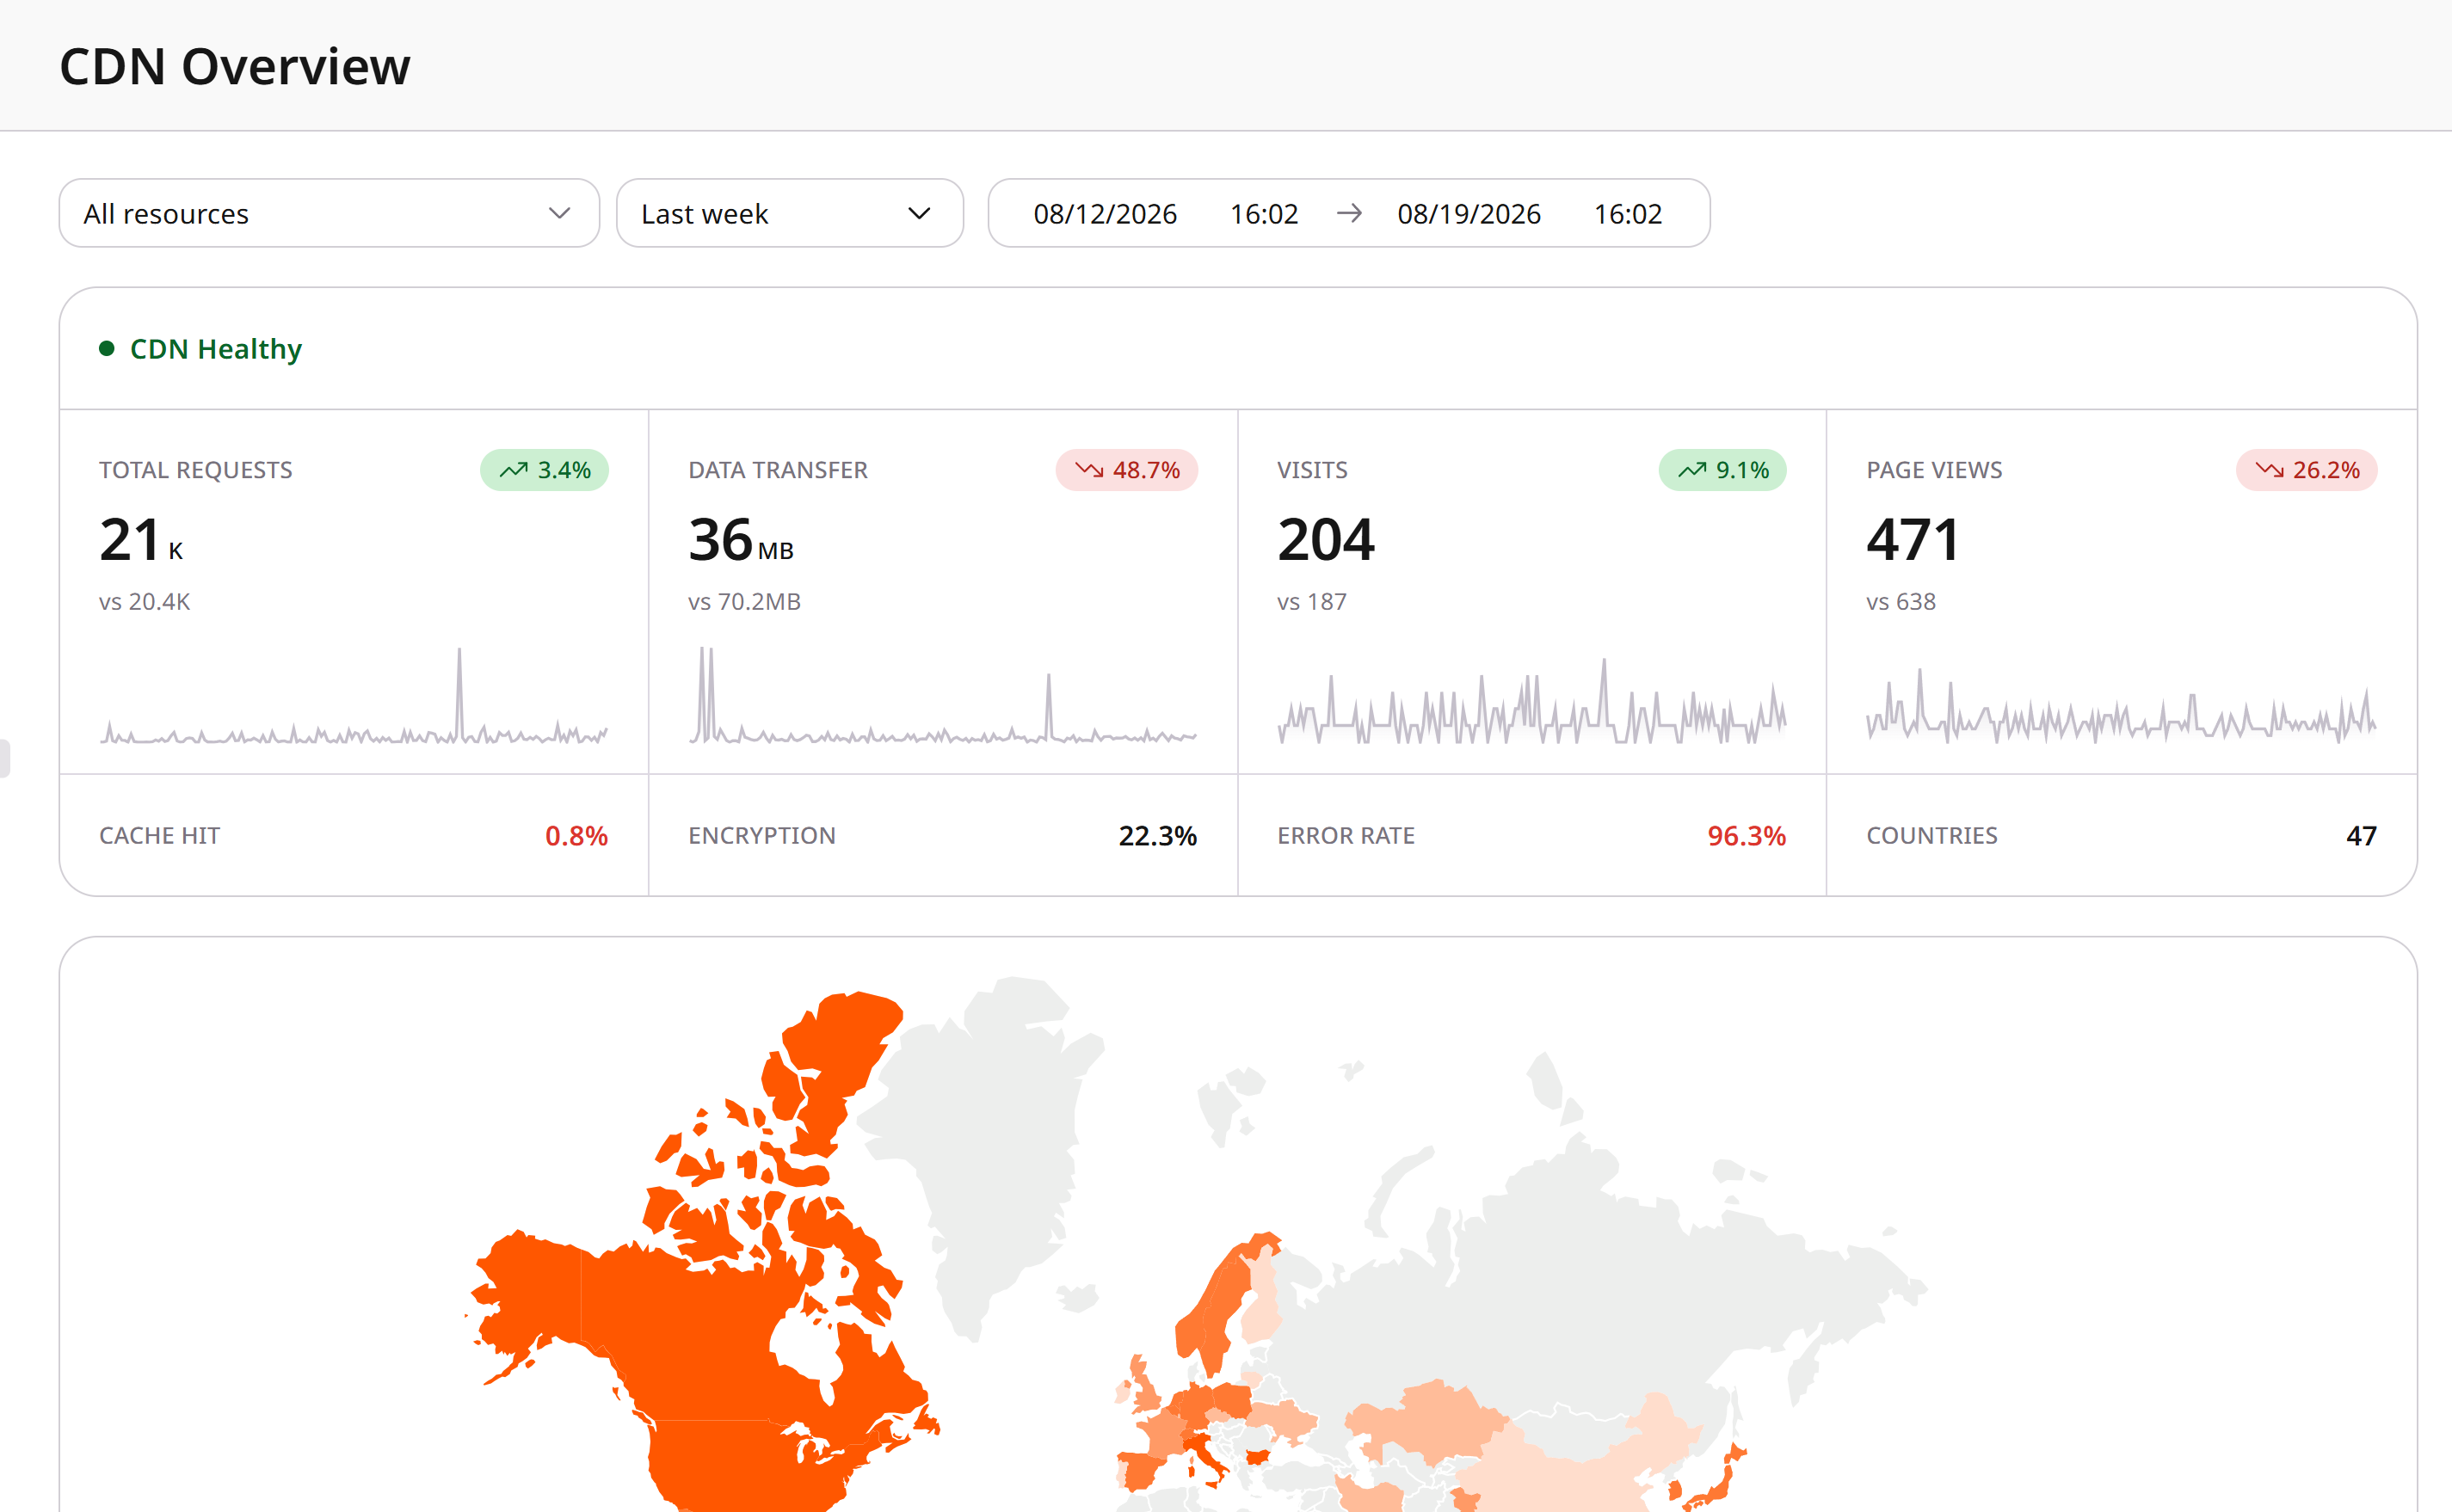
The dashboard groups the metrics into cards:
| Card | Information |
|---|---|
| Health status and traffic summary | Overall health, requests, data transfer, response time, and trends compared with the previous period |
| Traffic by geography | Request distribution by country |
| Cache performance | Cached requests, cache hit rate, cached data transfer, and data transfer hit rate |
| Errors | 4xx and 5xx counts and rates |
| Security | Encrypted requests and encrypted data transfer |
| Network protocols | HTTP version and content type |
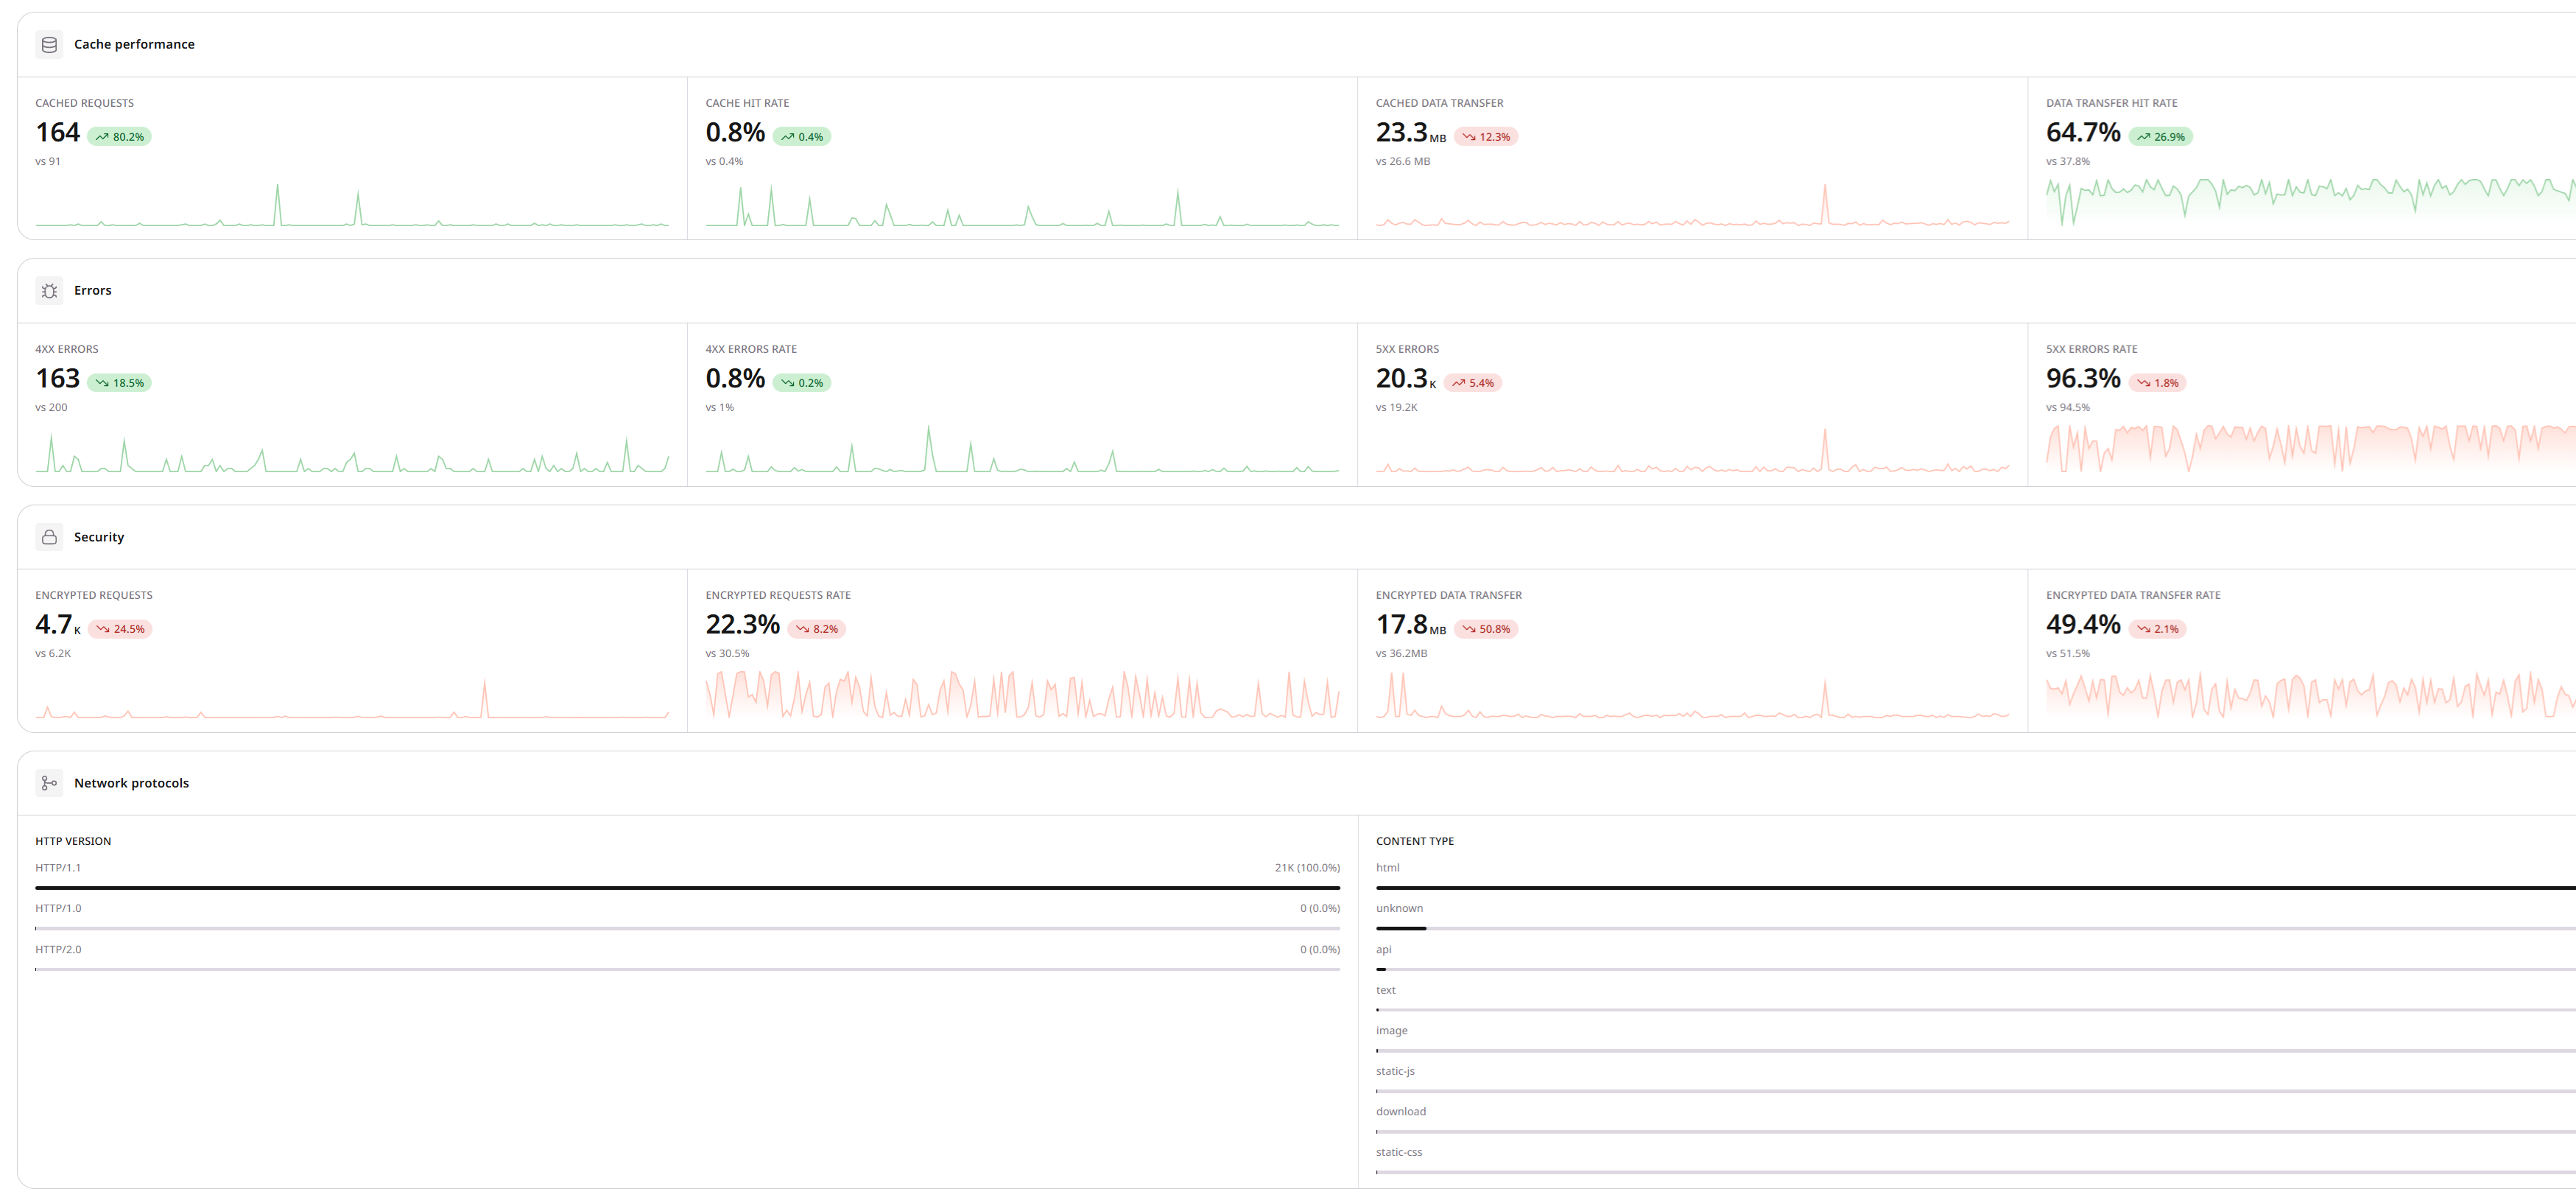
Metric status rules
Health status combines the 5xx response rate with the response-time baseline:
- Healthy — the 5xx rate is below 2% and latency is below 1.25 times the baseline
- Degraded — the 5xx rate is between 2% and 5%, or latency is between 1.25 and 2 times the baseline
- Unhealthy — the 5xx rate is at least 5%, or latency is at least 2 times the baseline
The status appears only when the selected period contains more than 1,000 requests and the latest 15-minute window contains more than 20 requests. Otherwise, the dashboard displays Insufficient data.
Cache hit rates above 90% appear in green, rates from 70% through 90% appear as degraded, and rates below 60% appear in red. The red threshold is a visual highlight on the dashboard and is not the troubleshooting threshold used in low cache hit ratio. Encryption rates above 90% appear in green.
Statistics reports for CDN resources
The Statistics report provides traffic, bandwidth, response, cache, request, and timing metrics for selected CDN resources. Basic reports are available on all plans.
For complete data, view statistics at least two days after the selected period ends. Recently completed periods may contain incomplete data.
- 1
Open Statistics
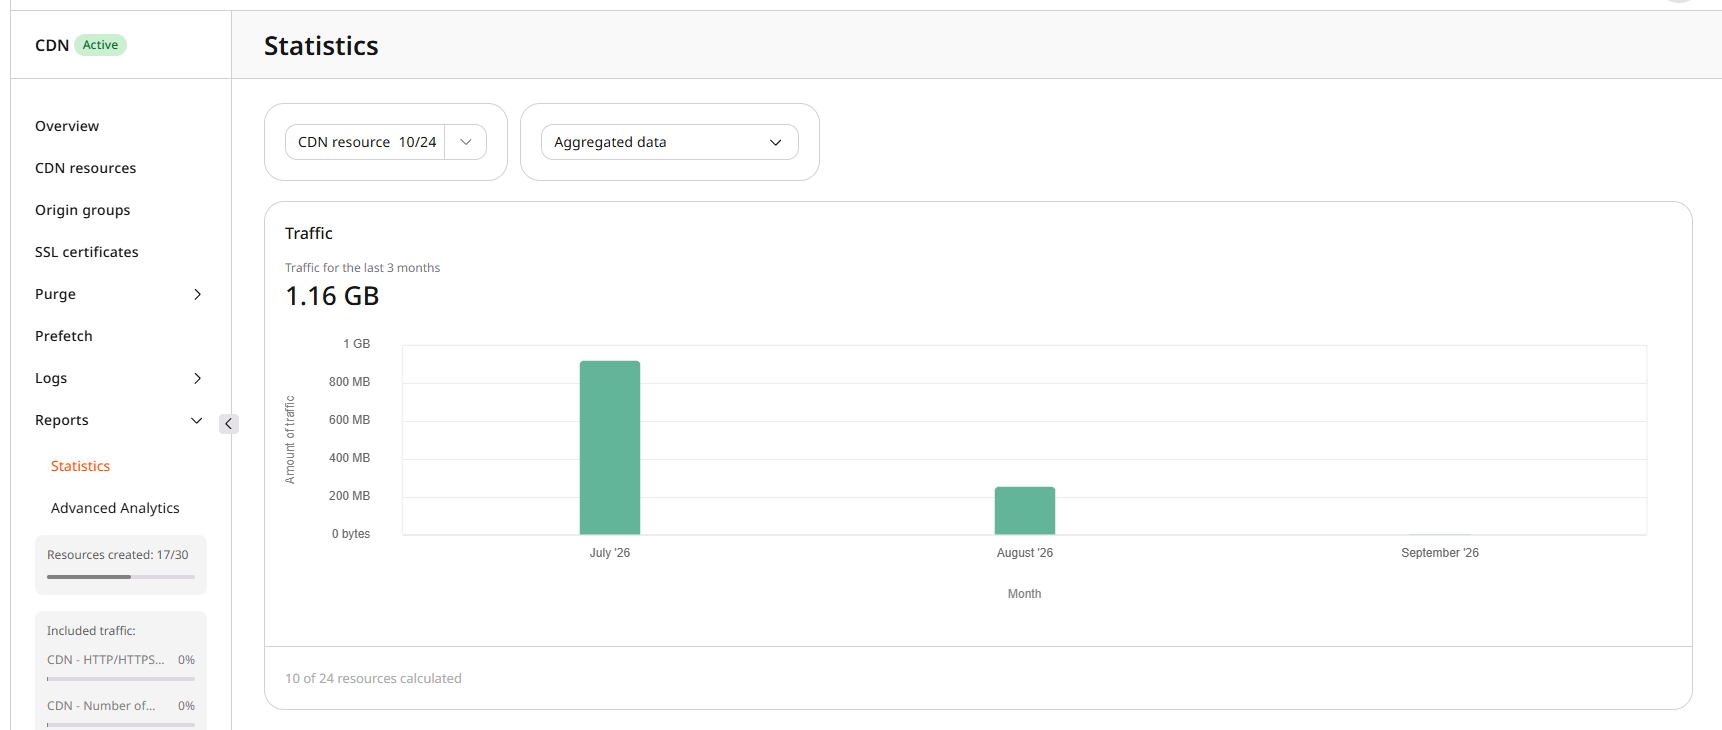
Navigate to CDN > Reports > Statistics.
- 2
Select resources and the report
In CDN resource, select one or more resources, then select a report.
Reports other than Aggregated data include a time interval and an auto-refresh period. Auto-refresh reloads the selected chart on a timer while the page stays open.
- 3
Review the report
The chart and summary metrics adapt to the selected report.
Charts on this page update while the selected period is still in progress, so they are useful for live monitoring. Complete data for a finished period is available at least two days later, and live charts can still differ from invoice totals because the two sources use different granularity periods.
Available reports
The report menu includes Aggregated data, Traffic, Bandwidth, Response classes, Response codes, Cache hit ratio, Requests, Traffic by region, Traffic by country, Image optimization, Request time, and Upstream response time.
| Report | What it shows |
|---|---|
| Aggregated data | Traffic and bandwidth for the previous three months, with MAX, MIN, and 95th-percentile bandwidth |
| Traffic by region | Traffic from servers in each region |
| Traffic by country | Traffic from the five countries with the highest traffic |
| Image optimization | Hourly WebP conversion count |
| Request time | Time from processing the first request bytes until logging after the last response bytes are sent |
| Upstream response time | Time to receive an origin response |
Advanced Analytics for CDN resources
Advanced Analytics adds reports for requests, traffic, and unique visitors, with filters for geography, directories, browsers, devices, and operating systems. This paid option requires activation through Support or an account manager.
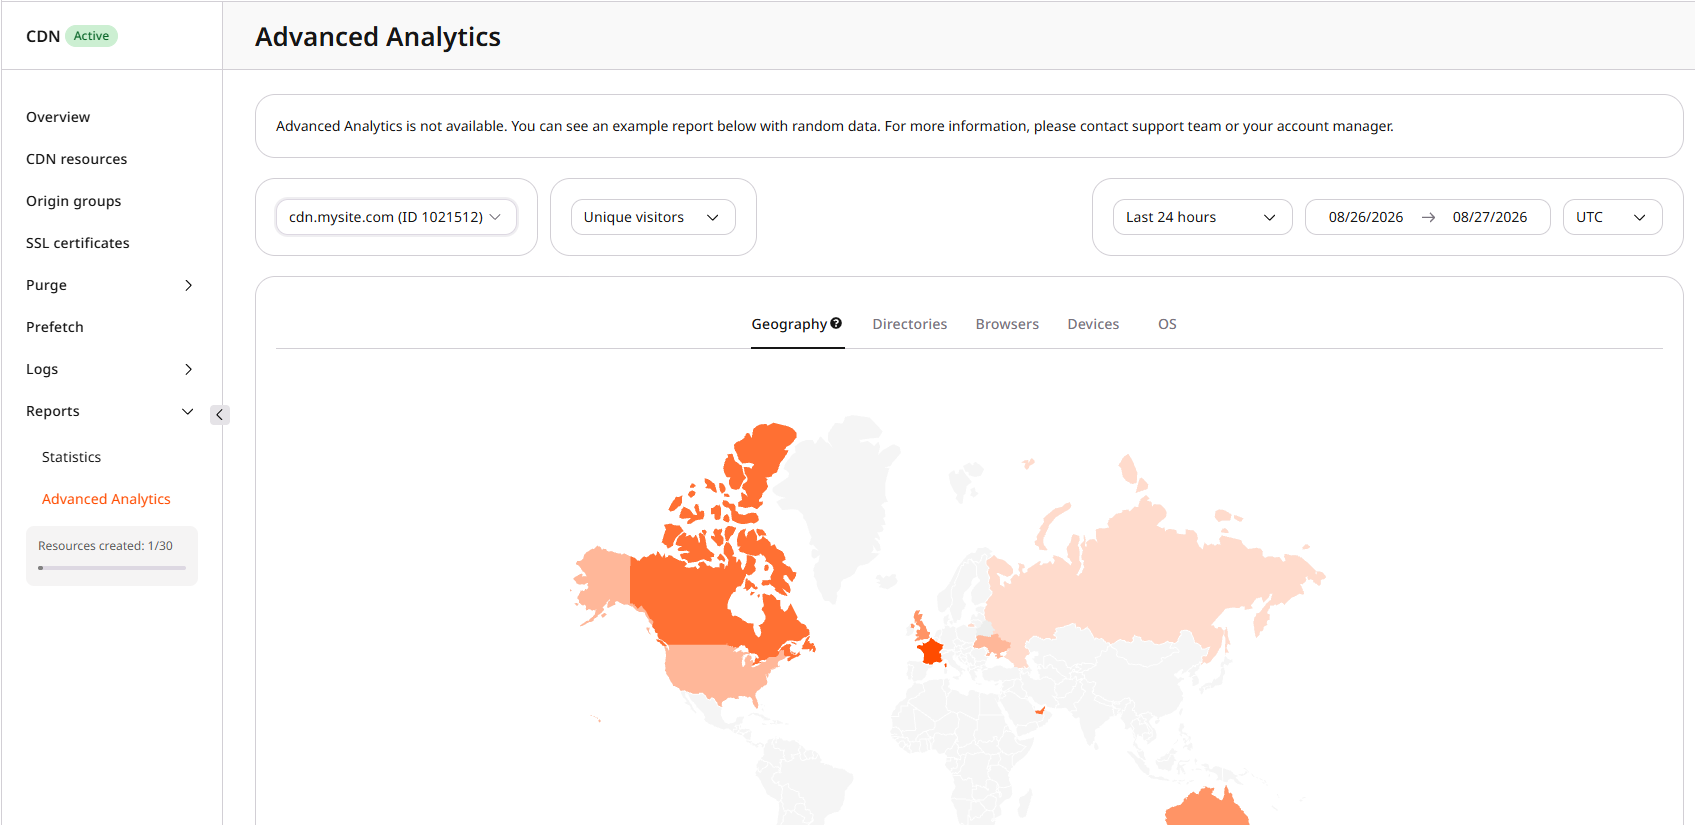
Until the option is activated, the page shows that Advanced Analytics is not available and an example report with random data. After activation, allow 24 hours for data collection.
- 1
Open Advanced Analytics
Navigate to CDN > Reports > Advanced Analytics.
- 2
Select report criteria
Select a CDN resource, a metric type (Requests, Traffic, or Unique visitors), a reporting period, and UTC or local time. Local time only changes how the chart labels timestamps. The stored values remain UTC, which is also the time zone for Overview and Statistics.
Unique visitors are counted by the combination of IP address and user agent, not as individual people. - 3
Filter the report
Select Geography, Directories, Browsers, Devices, or OS, then select the values to include in the chart.
The Geography filter maps traffic by country and compares selected countries in a chart.
Differences between report charts and billing
Invoice totals can differ from the charts above because billing and the Customer Portal read different NGINX sources.
CDB calculates billing and portal reports from different data sources:
- Billing statistics use NGINX access logs because invoice calculation prioritizes accuracy over processing speed.
- Customer Portal reports use the NGINX virtual host traffic status module to provide current resource statistics.