Events
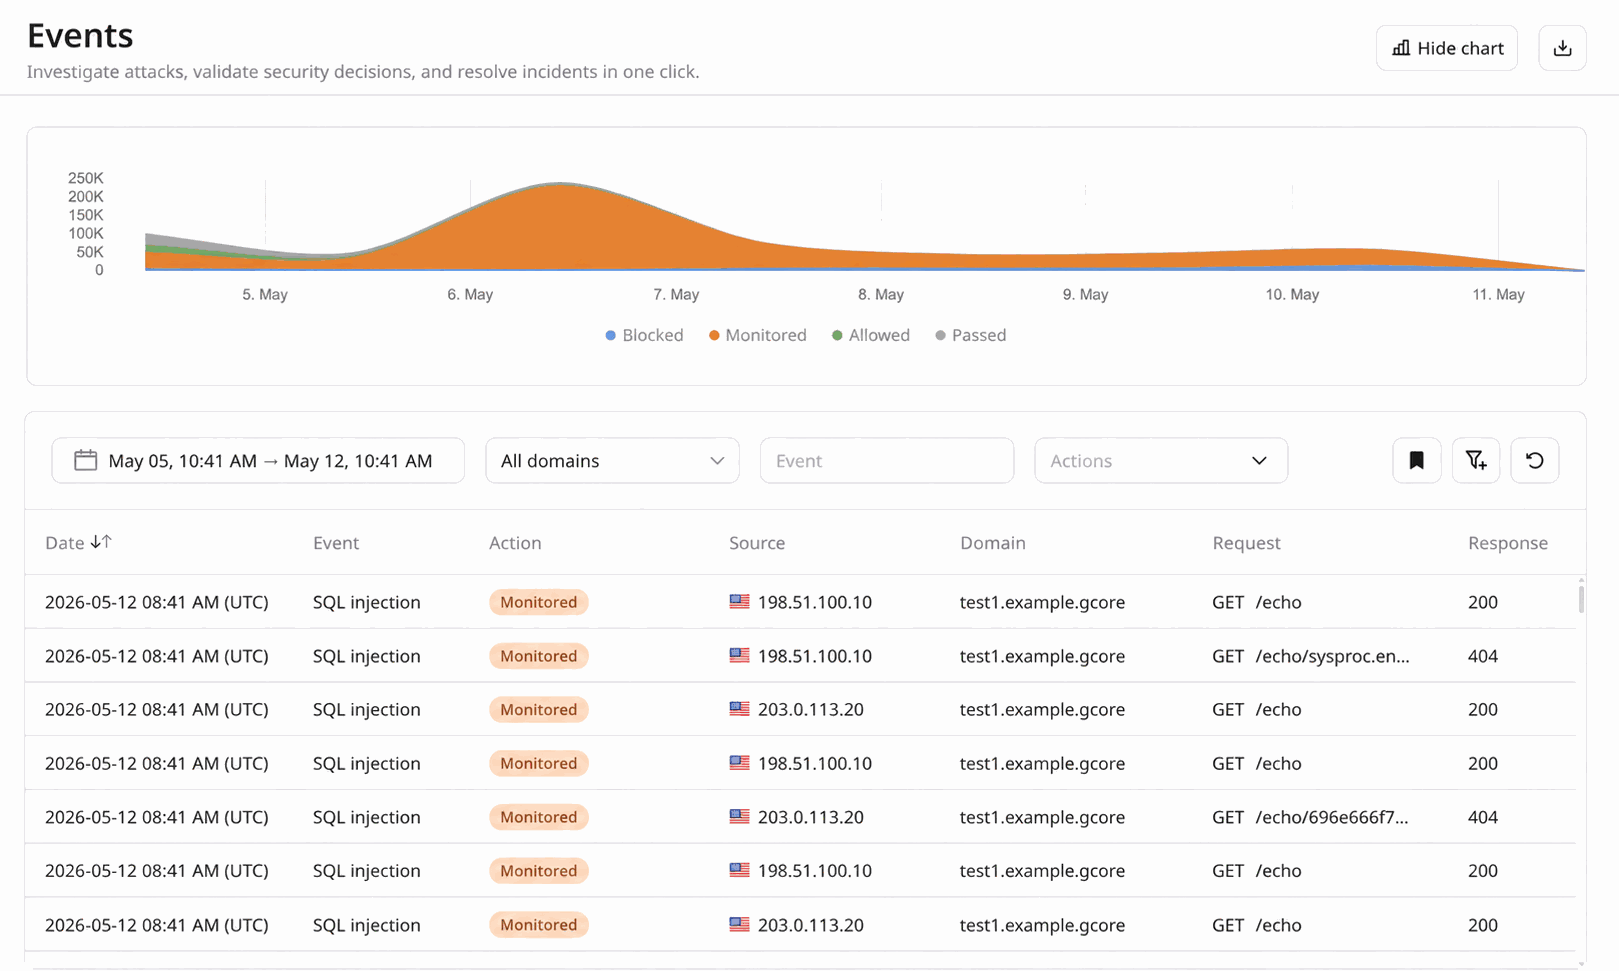
The Events page is the workspace for investigating HTTP requests and security events processed by WAAP. Use it to move from high-level attack patterns to individual requests, sessions, and security signals. Request history is retained for 30 days.
- 1
Open the Customer Portal
Sign in to the CDB Technical Web Portal.
- 2
Open Events
Navigate to WAAP > Analytics > Events.
Event filtering
Raw request logs are too large to review by hand. Combine filters to isolate the traffic for an investigation — for example POST requests to /login from a specific country that were blocked during a five-minute window. Applied filters also update the Events charts: request volume over time, the mix of decisions (Blocked, Monitored, Allowed, Passed) and optional actions (CAPTCHA, JS Challenge), and the split between suspicious and legitimate traffic.
By default, the toolbar shows:
- Time range — isolate the exact period when suspicious activity occurred.
- Domain — focus the investigation on traffic targeting all domains, or a specific domain.
- Event — focus on a security signal or detection, including DDoS. Type a rule name and add it, for example
SQL InjectionorDDoS. - Actions — combine the mitigation decision and any extra challenge in one filter. Each dropdown has an Include / Exclude switch. Values are Blocked, Monitored, Allowed, Passed, Captcha, and JS Challenge. For example, Include + Blocked + Captcha returns requests blocked after a failed Captcha.
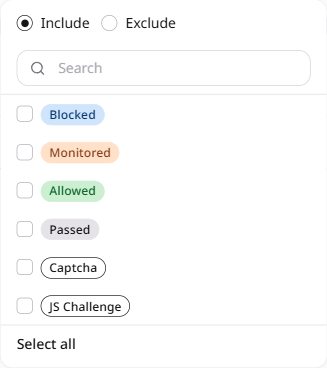
Open Add filter to add more dimensions. Every added dropdown also has Include / Exclude.
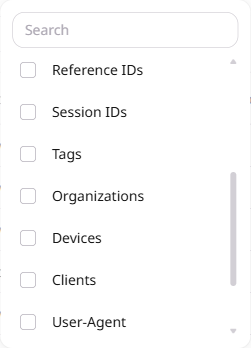

- Countries — analyze traffic based on geographic origin.
- IP address — investigate activity from a specific client.
- Response Codes — correlate security events with application behavior.
- HTTP Methods — distinguish between request types such as GET, POST, PUT, PATCH, or DELETE.
- Path — focus on a particular application endpoint or API route. Accepts a URL path or a glob-like pattern, for example
/api/v1/*matches all endpoints under that prefix. - Request ID — inspect one or more specific requests. Multiple request IDs can be provided as a comma-separated list.
- Reference IDs — group repeated requests that triggered the same security rule. Multiple reference IDs can be provided as a comma-separated list.
- Session IDs — analyze sequences of requests generated within one client session. Multiple session IDs can be provided as a comma-separated list.
- Organizations — filter by the WHOIS organization on the client IP. Values are those seen in the selected time range.
- ASN — filter by the autonomous system number of the client IP.
- Devices and Clients — filter by the parsed user-agent device and client family. Values are those seen in the selected time range.
- Tags — filter by tags WAAP assigned to the request, for example
Injection Attack. - User-Agent — case-insensitive partial match on the user-agent string.
- JA3 — filter by the JA3 TLS fingerprint of the originating client. Useful for identifying botnets that share a common network stack regardless of IP address.
- JA4 — filter by the JA4 TLS fingerprint of the originating client. JA4 normalizes handshake fields that browsers may reorder between sessions, producing more stable fingerprints for modern TLS clients.
Security analysts, SREs, and DevSecOps engineers use Events to investigate suspicious traffic, validate enforcement actions, detect recurring attack patterns, confirm whether rules behave as expected, and export evidence for incident response.
Inspecting an individual event
Click an event in the list to expand the row and reveal fields that are not shown as table columns. Those fields explain why a request was flagged and where it originated.
Key fields in the expanded view include:
- Organization — the name of the organization that owns the client IP address, sourced from WHOIS data. This helps analysts attribute traffic to a hosting provider, cloud platform, ISP, or corporate network, which is often a strong signal when distinguishing legitimate users from automated or malicious infrastructure.
- Tags — threat category labels assigned by WAAP, such as Injection Attack or SQL Injection. Tags reflect the high-level threat classification detected for the request, giving analysts an immediate understanding of the type of threat behind a security event without inspecting the raw payload.
- Detector and Payload — shown together in the portal only when a WAF and OWASP Top Threats signature matched (for example SQL injection or XSS) and the first detector has a non-empty
matched_content. If there is no matched fragment, the section is not shown. They stay hidden for bot, IP reputation, CSRF, custom-rule, and DDoS events. Detector shows the signature ID and the request part that matched, for exampleID862 in query_params. Payload shows the matched fragment (matched_content): URL-encoded and limited to 200 characters. The portal shows the first detector; the API returns the fulldetectorlist. The top-level rule name on the event is the policy that made the decision;detectorlists the signatures inside that policy. - JA3 and JA4 — TLS fingerprints computed from the client's TLS handshake. Both values appear as dedicated fields in the event details panel for HTTPS requests. Use them to identify clients by network stack rather than IP address, or to pivot from an event directly into a fingerprint-based filter.
Organization indicates who the request came from. Tags classify the threat. Detector and Payload show which signature matched and on which fragment. JA3/JA4 fingerprints identify the client network stack.
Exporting events
WAAP provides two export paths: a CSV download of the events currently loaded in the table, and continuous delivery of CDN request logs that include WAAP fields.
Export from the Events page
The Events page downloads the events currently loaded in the table as a CSV file. That file is not the full filtered result set. For a complete extract, use the Get security events endpoint and page through results with the next cursor.
- 1
Apply the investigation filters
Set the time range and any other filters first. The CSV contains the events currently loaded in the table after those filters are applied.
- 2
Download the CSV
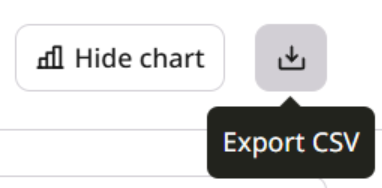
Click the download icon in the toolbar. The control is labeled Export CSV. The browser downloads a CSV file.
Continuous export via Logs Uploader
For automated pipelines and long-term retention, configure Logs Uploader. When WAAP is enabled on a CDN resource, WAAP fields are appended to each CDN request-log entry. Logs Uploader does not deliver a separate WAAP event stream.
Real-world investigation scenarios
Investigating an API attack
A backend team notices abnormal behavior on /api/login. A security analyst opens Events and filters traffic by time range, path, and HTTP method.
The filtered dataset reveals a burst of POST requests from a limited set of IP addresses, triggering authentication-related rules. The analyst confirms that WAAP blocked the majority of these requests and identifies the activity as credential-stuffing automation.
Distinguishing legitimate automation from malicious bots
Some services rely on legitimate automated traffic from partners or internal integrations. However, malicious bots may produce similar patterns.
By filtering events by country, session ID, and decision, analysts can distinguish legitimate automation from abusive scripts attempting to scrape content or overload endpoints.
Validating a new security rule
After deploying a new custom rule, a DevSecOps engineer reviews Events to confirm that the rule correctly identifies malicious requests without affecting legitimate traffic.
The analyst filters by time range and decision to review blocked versus allowed requests and confirm that the policy change behaves as intended.
Investigating repeated attacker behavior
Automated attacks often generate sequences of requests rather than isolated events.
By pivoting from an IP address to a session ID or reference ID, analysts can observe the full sequence of requests generated by a single automated workflow. This helps determine whether the attacker is scanning, probing authentication flows, or attempting exploitation.
Exporting evidence for incident response
Once relevant traffic is isolated, analysts can download the events loaded in the table as a CSV file, or use the API with pagination for a complete extract.
This allows teams to:
- attach traffic samples to incident reports.
- share evidence with SOC teams.
- provide technical context to engineering teams.
- document mitigation effectiveness.
Recommended investigation workflow
Work through Events in this order:
- 1
Narrow the timeframe of the incident
- 2
Identify the affected endpoint or domain
- 3
Review mitigation decisions taken by WAAP
- 4
Pivot to source indicators such as IP address or session ID
- 5
Export relevant events for documentation or response